Adding Zebrium Root Cause Reports to your New Relic Dashboards
Integration Overview
- Create an API Key in New Relic.
- Create a New Relic Integration in Zebrium using the information from step 1.
- Add Zebrium Root Cause Report events and Log metrics to your New Relic Dashboard.
Integration Details
STEP 1: Create an API Key in New Relic
- From the Settings pull-down, select API keys.
- Click on Create a key.
- Choose the appropriate Account and note the Account Id for use in STEP 2.
- Select Ingest - License as the Key type.
- Enter a Name for the API key and click Create a key.
- Copy and save the Key for use in STEP 2.
STEP 2: Create a New Relic Outbound Integration in Zebrium
- From the User menu area, click on the Settings (hamburger) Menu.
- Select Integrations.
- Scroll to the Observability Dashboards section and click on New Relic.
- Click on the Create a New Integration button.
- Click on the General tab.
- Enter an Integration Name for this integration.
- Select the Deployment for the integration.
- Select the Service Group(s) for the integration.
- Click on the Send Detections tab.
- Click on the Enabled button.
- Enter the Account Id from STEP 1 above.
- Enter the API Key from STEP 1 above.
- Click the Save button.
STEP 3: Add Zebrium Root Cause Report detections and Log metrics to your New Relic Dashboard(s)
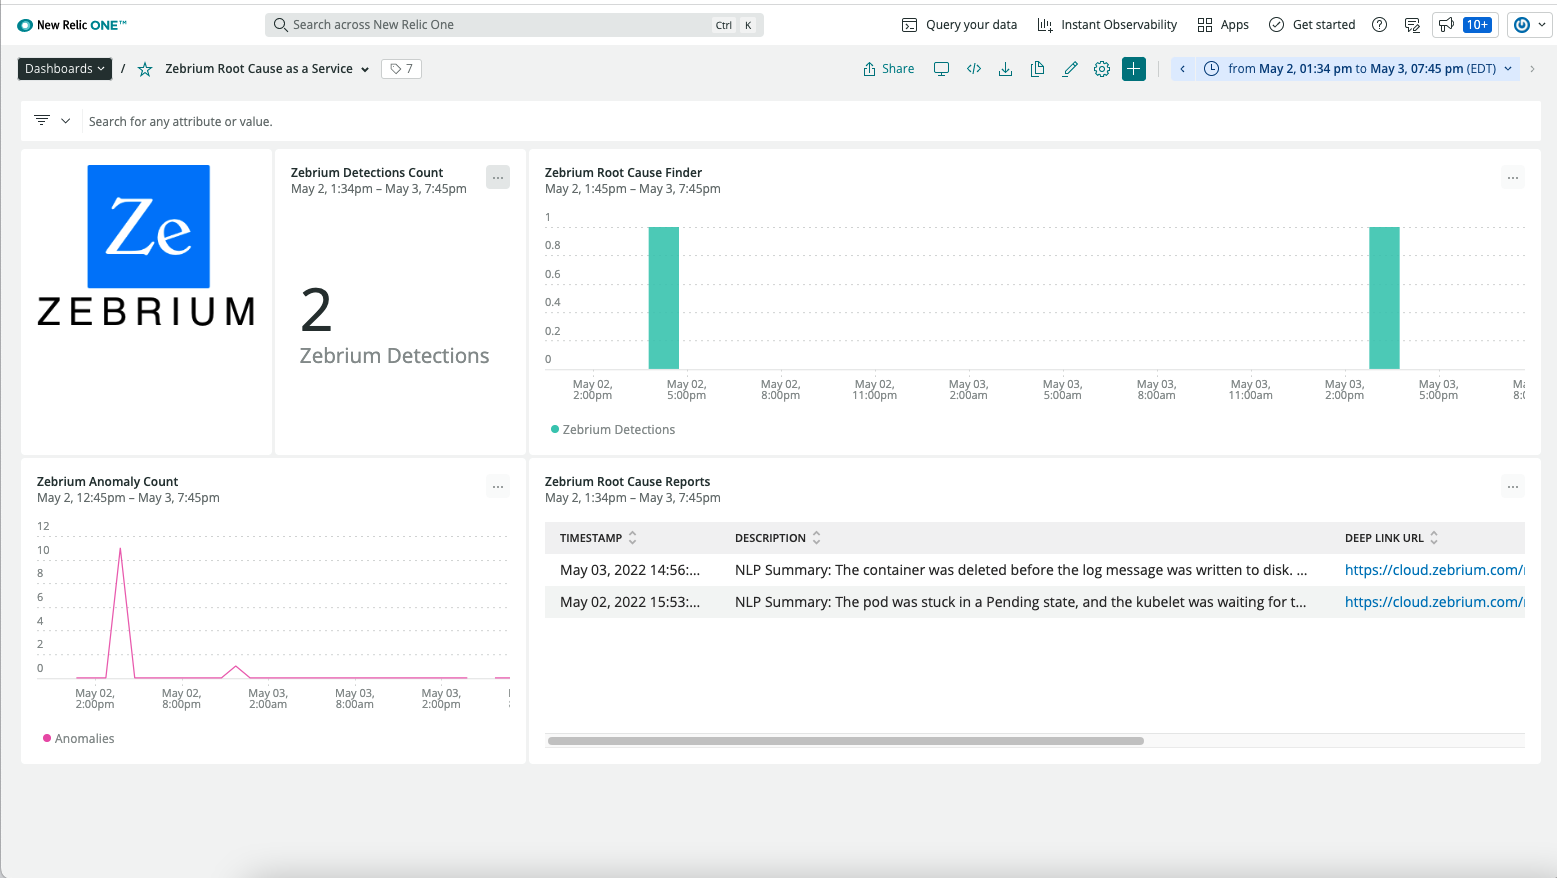
We recommend adding a few charts to your existing New relic dashboards so that you can see details of Zebrium root cause reports alongside your other observability data.
The screen shot below shows a sample New Relic dashboard with the following Zebrium charts:
- A count of Zebrium Root Cause Report Detections
- A Zebrium Root Cause Finder chart with a green vertical bar wherever a detection occurs. This is useful when used on other dashboards as you can visually correlate what you are seeing in other data with what Zebrium has automatically detected.
- A chart showing log anomaly counts
- A chart containing a list of root cause report summaries
Sample New Relic Zebrium dashboard:
The following screen shots show the definitions for each of the charts above:
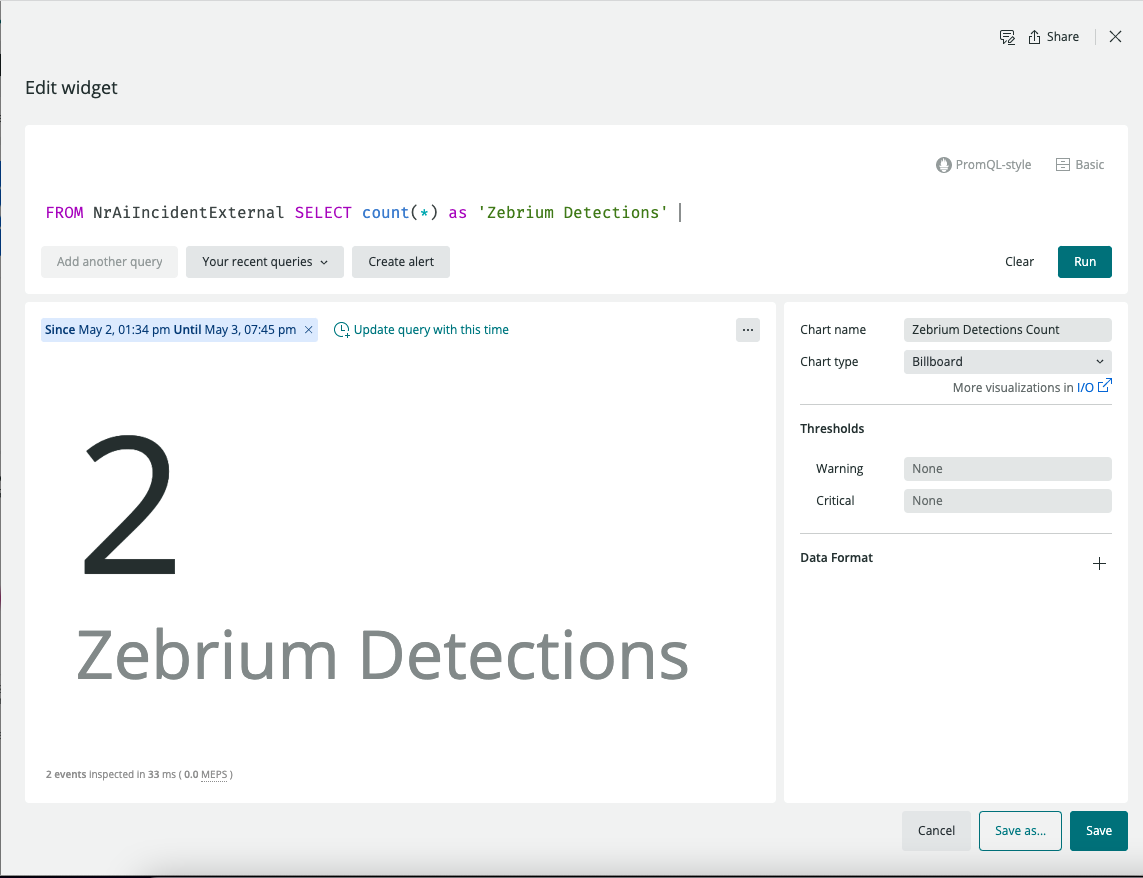
Count of Zebrium Root Cause Report Detections:
Root cause finder showing where detections occur:
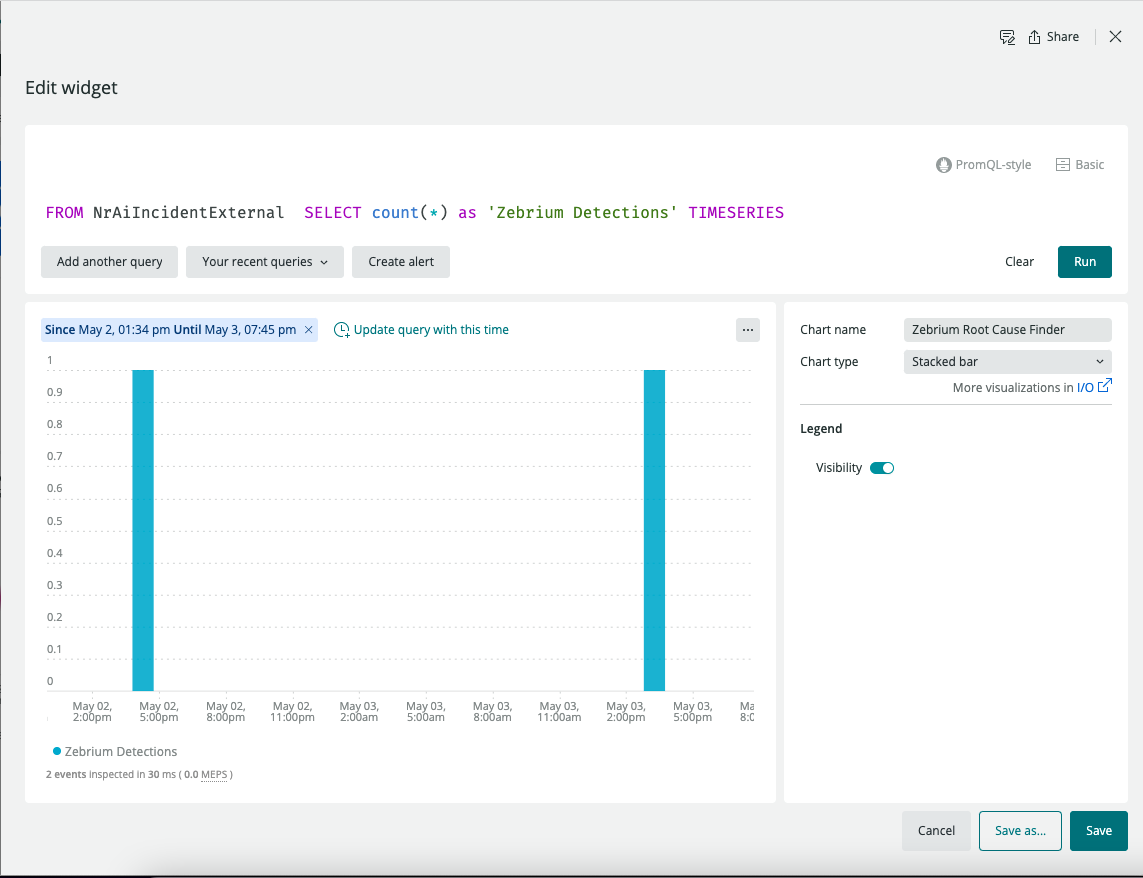
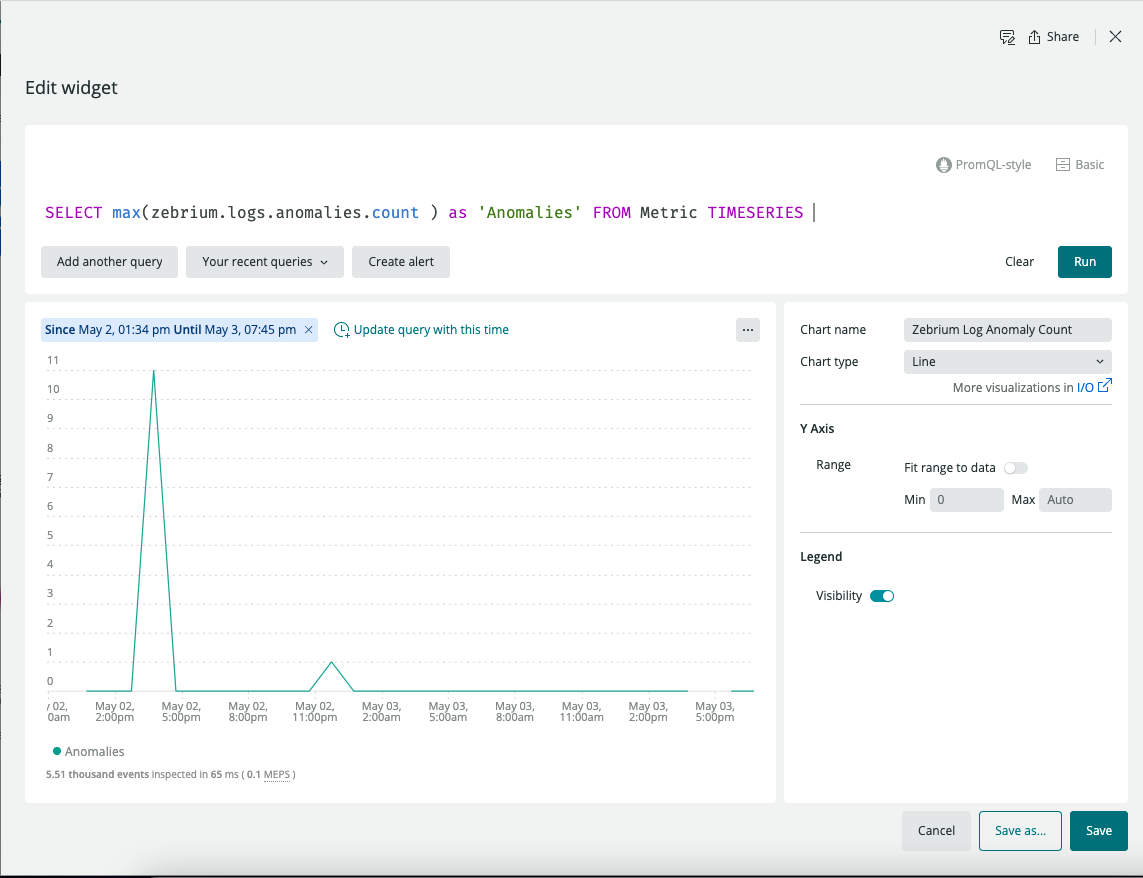
Chart of log anomaly counts:
List of root cause report summaries:
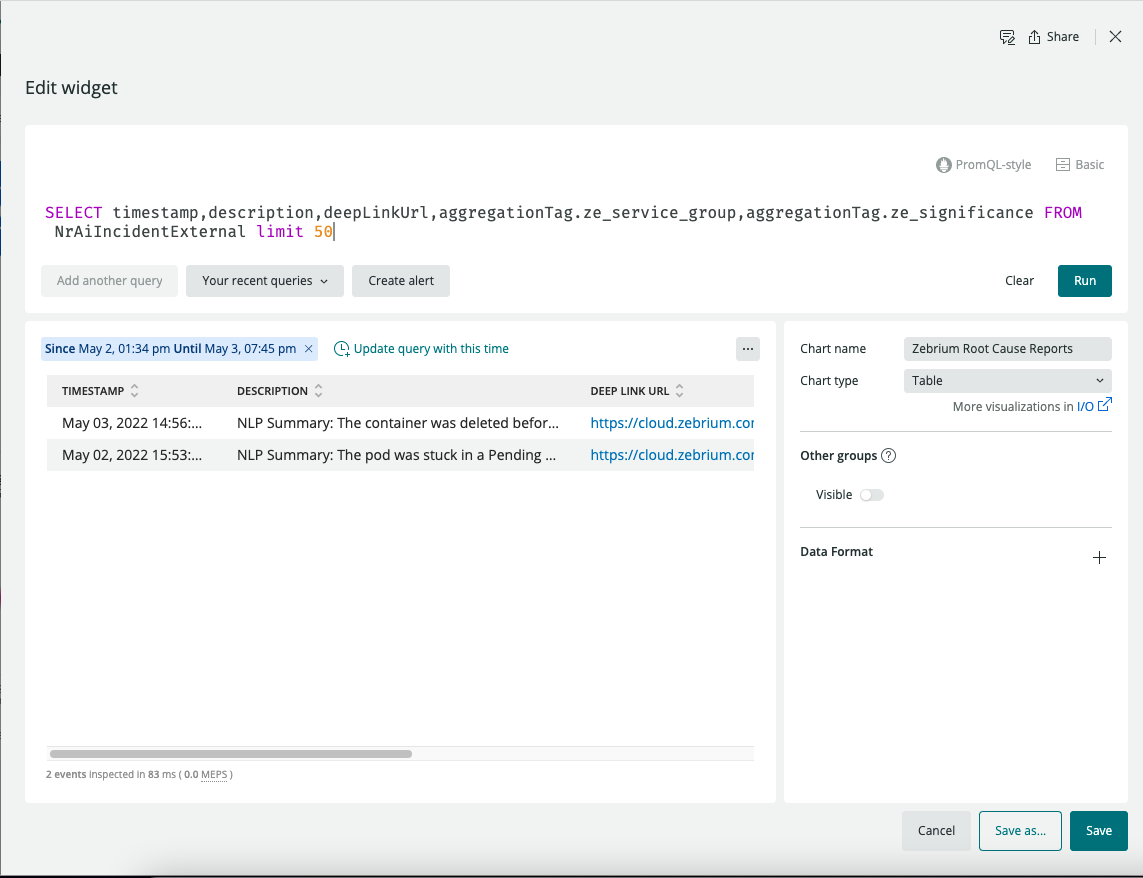
Table of Important Metrics
| Metric Name | Description |
|---|---|
| zebrium.logs.all.count | Count of all log events received in a one minute duration (per service_group) |
| zebrium.logs.anomalies.count | Count of anomaly log events received in a one minute duration (per service_group) |
| zebrium.logs.errors.count | Count of error log events received in a one minute duration (per service_group) |
Zebrium Detections Event Payload
Zebrium Detections are sent to New Relic as Custom Events with eventType of NrAiIncidentExternal
Here is a sample NrAiIncidentExternal payload for a Zebrium detection with descriptions of each field:
    {
      "aggregationTag.ze_deployment": "this is the deployment name",
      "aggregationTag.ze_first_occurrence": "set to true if this is the first occurrence of this type of incident",
      "aggregationTag.ze_inci_id": "00062722-5f20-0000-0000-5190000353ee",
      "aggregationTag.ze_service_group": "this is the zebrium service group name",
      "aggregationTag.ze_significance": "significance of the detection: low, medium or high",
      "deepLinkUrl": "this is the URL in the Zebrium UI for this root cause report",
      "description": "this is usually the NLP summary for the root cause report",
      "entityName": "zebrium_detections",
      "source": "zebrium_detections",
      "state": "trigger",
      "timestamp": 1651647986000,
      "title": "Zebrium Detected Root Cause Report",
      "version": 1
    }
Support
If you need help with this integration, please contact Zebrium by emailing support@zebrium.com.