Adding Zebrium Root Cause Reports to your New Relic Dashboards
Follow the steps below to setup the Zebrium integration for New Relic. This will allow you to visualize Zebrium auto-detected root cause reports on any New Relic dashboard.
Integration Overview
- Create an API Key in New Relic.
- Create a New Relic Integration in Zebrium using the information from step 1.
- Add Zebrium Root Cause Report events and Log metrics to your New Relic Dashboard using the Zebrium quickstart.
Integration Details
STEP 1: Create an API Key in New Relic
- From the Settings pull-down, select API keys.
- Click on Create a key.
- Choose the appropriate Account and note the Account Id for use in STEP 2.
- Select Ingest - License as the Key type.
- Enter a Name for the API key and click Create a key.
- Copy and save the Key for use in STEP 2.
STEP 2: Create a New Relic Outbound Integration in Zebrium
- From the User menu area, click on the Settings (hamburger) Menu.
- Select Integrations.
- Scroll to the Observability Dashboards section and click on New Relic.
- Click on the Create a New Integration button.
- Click on the General tab.
- Enter an Integration Name for this integration.
- Select the Deployment for the integration.
- Select the Service Group(s) for the integration.
- Click on the Send Detections tab.
- Click on the Enabled button.
- Enter the Account Id from STEP 1 above.
- Enter the API Key from STEP 1 above.
- Click the Save button.
STEP 3: Visualize Zebrium auto-detected root cause reports with the Zebrium quickstart
The quickest way to start seeing Zebrium root cause reports on any New Relic dashboards is to install the New Relic I/O (Instant Observability) Zebrium quickstart.
- Go to the Zebrium quickstart New Relic I/O, and click the green “Install now” button.
- If you don’t have a New Relic account, follow the sign up instructions to get started for free.
- Select an account and select Begin installation.
- Follow the instructions in the installation docs or, if you have already completed Steps 1 and 2 above, just click “Done”.
- Click the “See your data” button.
The above steps will install some sample Zebrium dashboard panels. We recommend copying the “Zebrium Root Cause Finder” and “Zebrium Root Cause Reports” panels to your other dashboards so you can see Zebrium detections alongside other dashboard charts.
More details on the panels and queries behind them appears below:
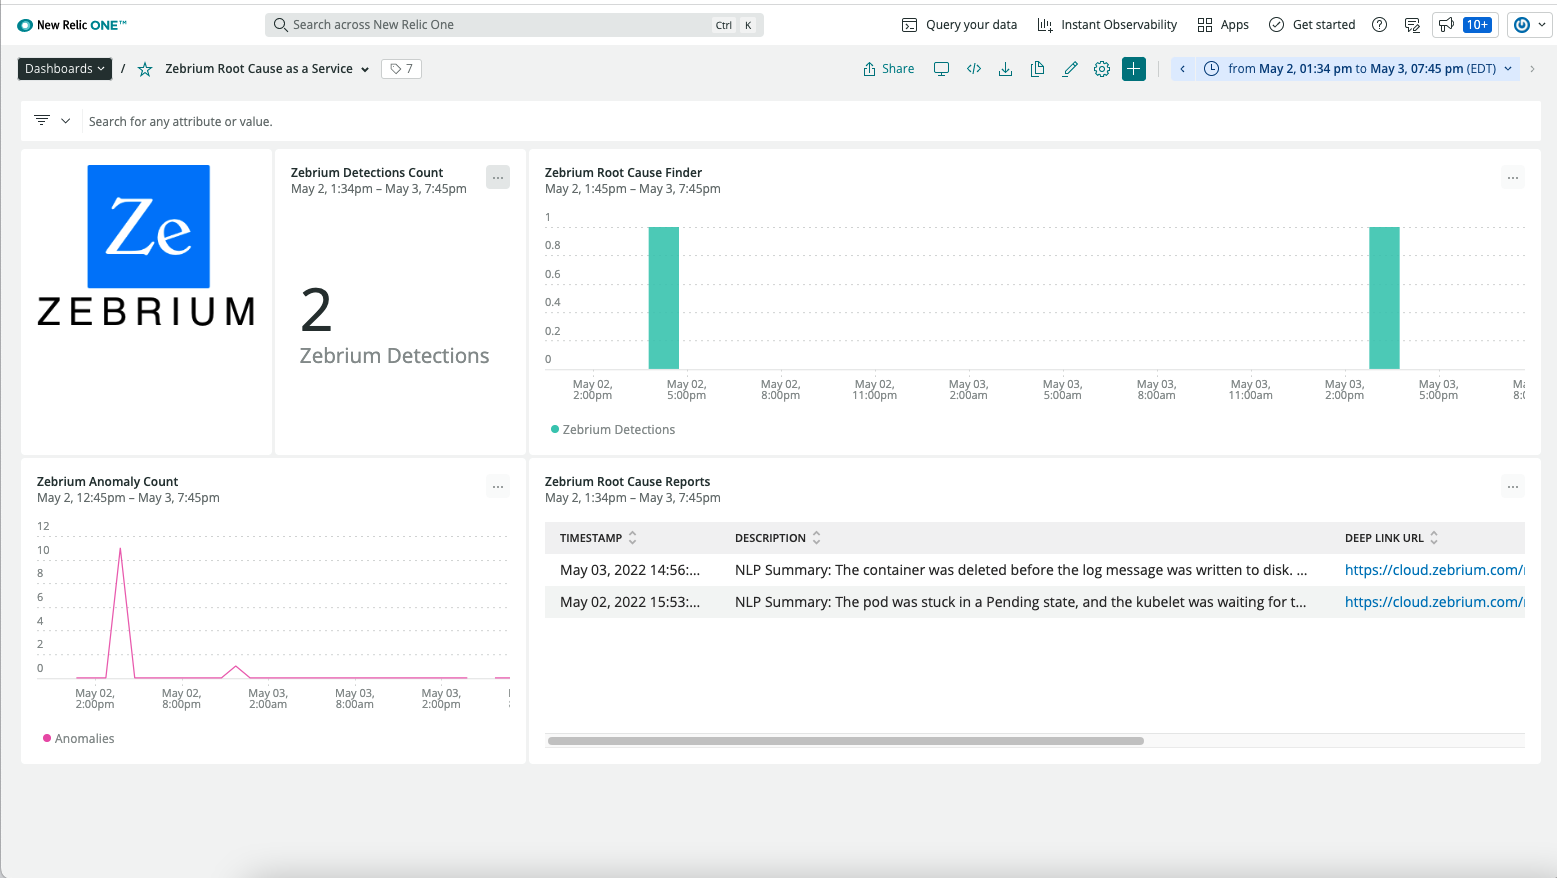
The screen shot below shows a New Relic dashboard with the following Zebrium charts:
- A count of Zebrium Root Cause Report Detections
- A Zebrium Root Cause Finder chart with a green vertical bar wherever a detection occurs. This is useful when used on other dashboards as you can visually correlate what you are seeing in other data with what Zebrium has automatically detected.
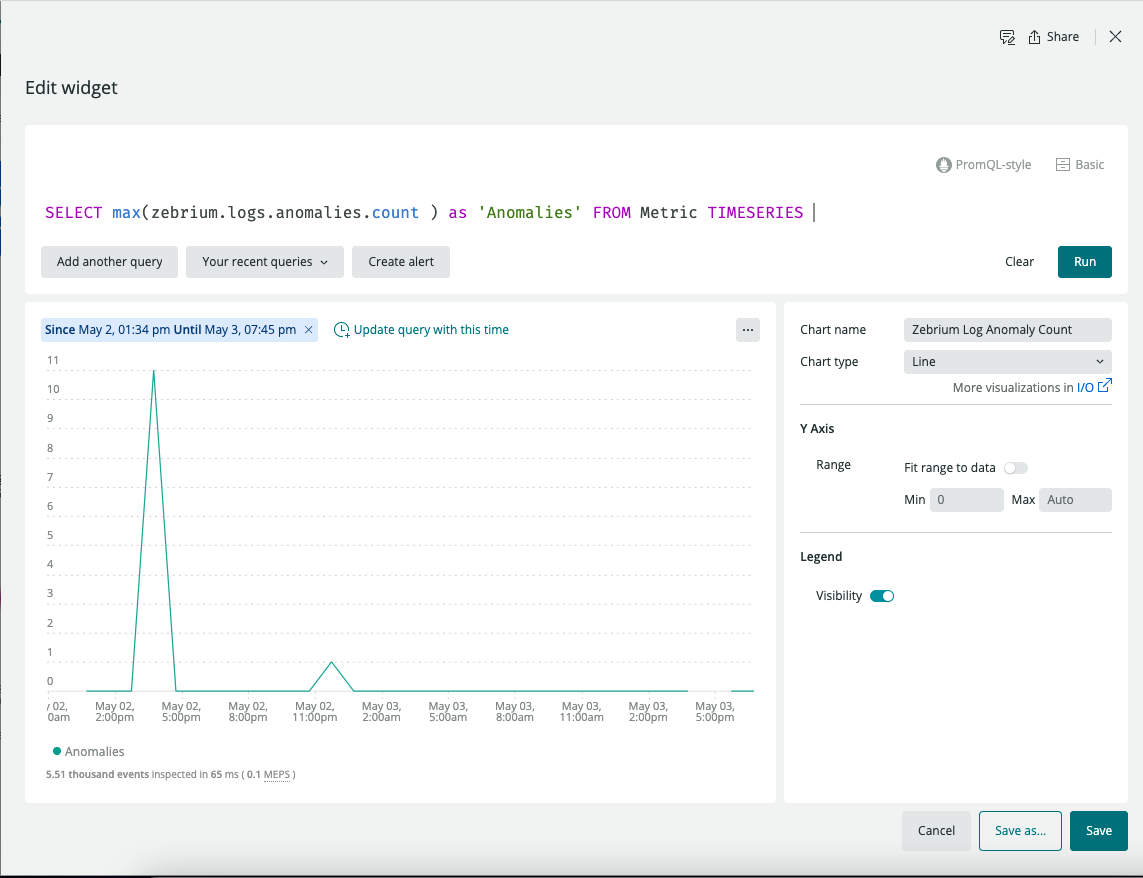
- A chart showing log anomaly counts
- A chart containing a list of root cause report summaries
Sample New Relic Zebrium dashboard:
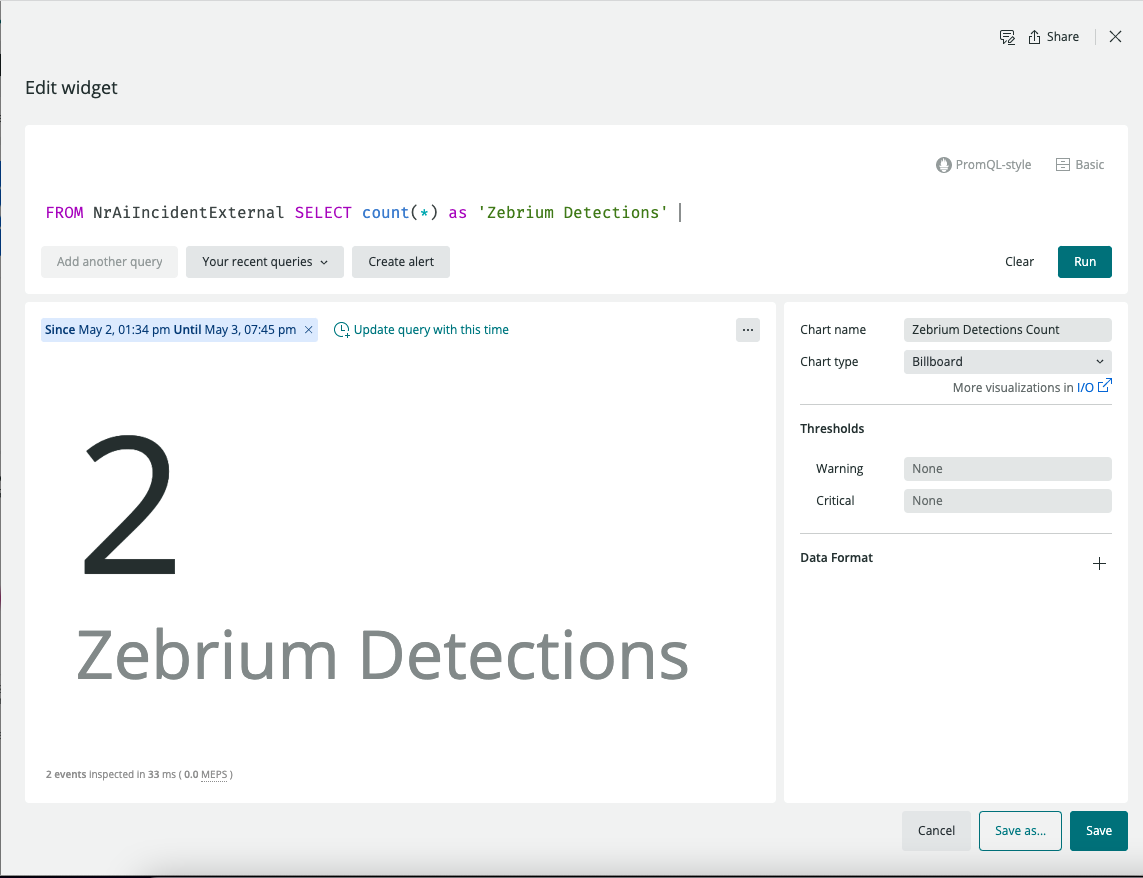
The following screen shots show the definitions for each of the charts above:
Count of Zebrium Root Cause Report Detections:
Root cause finder showing where detections occur:
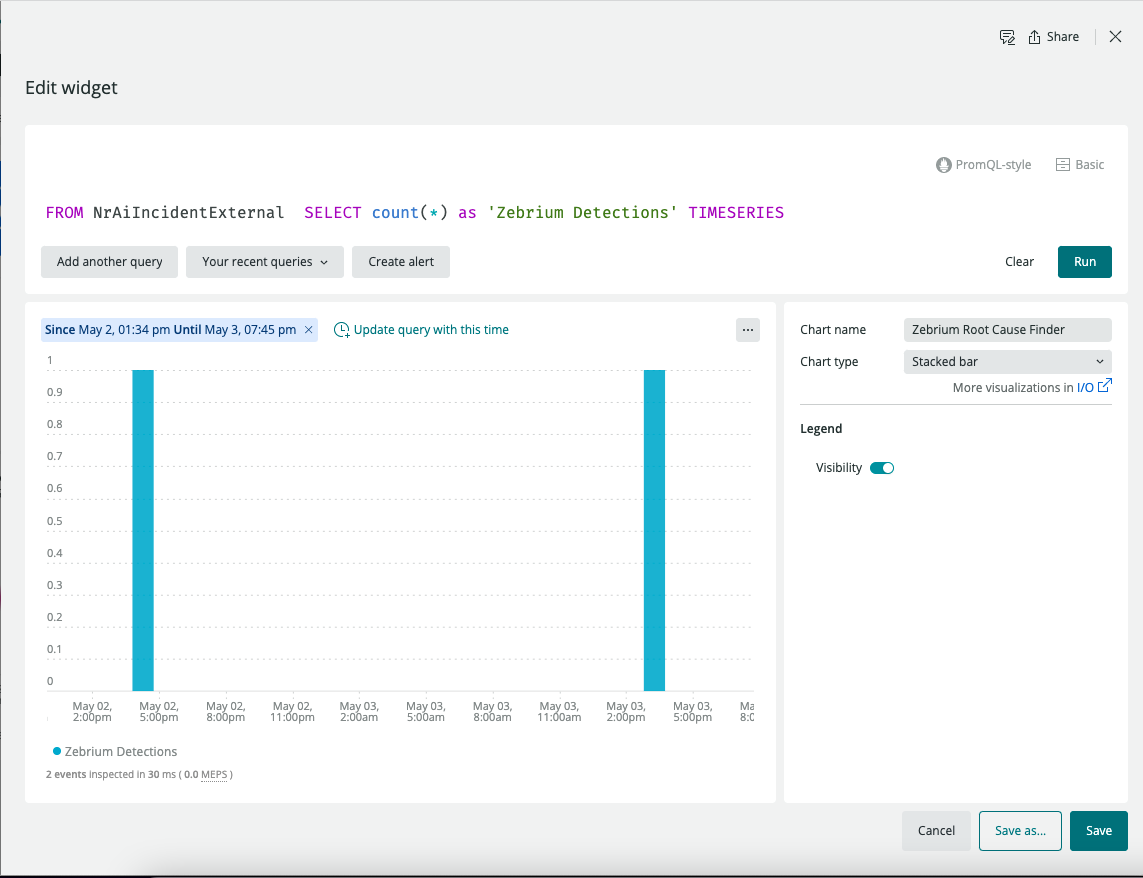
Chart of log anomaly counts:
List of root cause report summaries:
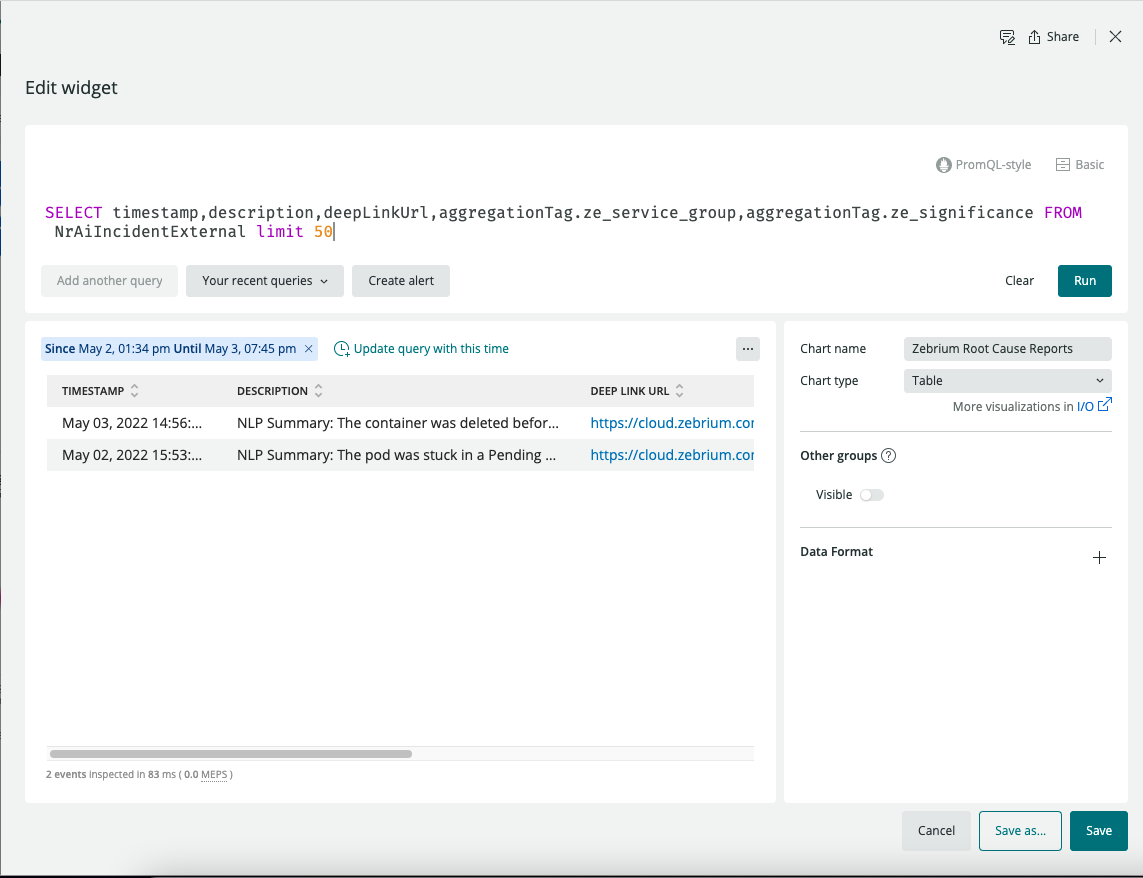
Table of Important Metrics
| Metric Name | Description |
|---|---|
| zebrium.logs.all.count | Count of all log events received in a one minute duration (per service_group) |
| zebrium.logs.anomalies.count | Count of anomaly log events received in a one minute duration (per service_group) |
| zebrium.logs.errors.count | Count of error log events received in a one minute duration (per service_group) |
Zebrium Detections Event Payload
Zebrium Detections are sent to New Relic as Custom Events with eventType of NrAiIncidentExternal
Here is a sample NrAiIncidentExternal payload for a Zebrium detection with descriptions of each field:
    {
      "aggregationTag.ze_deployment": "this is the deployment name",
      "aggregationTag.ze_first_occurrence": "set to true if this is the first occurrence of this type of incident",
      "aggregationTag.ze_inci_id": "00062722-5f20-0000-0000-5190000353ee",
      "aggregationTag.ze_service_group": "this is the zebrium service group name",
      "aggregationTag.ze_significance": "significance of the detection: low, medium or high",
      "deepLinkUrl": "this is the URL in the Zebrium UI for this root cause report",
      "description": "this is usually the NLP summary for the root cause report",
      "entityName": "zebrium_detections",
      "source": "zebrium_detections",
      "state": "trigger",
      "timestamp": 1651647986000,
      "title": "Zebrium Detected Root Cause Report",
      "version": 1
    }
Support
If you need help with this integration, please contact Zebrium by emailing support@zebrium.com.