View Root Cause Detections in your Grafana Dashboards
Integration Overview
- Create a secure access token in Zebrium for the Zebrium Datasource.
- Download Plugins from GitHub.
- Sign & Install Plugins.
- Setup Zebrium Datasource.
- Install Zebrium Root Cause Finder on a dashboard.
Prerequisites
- File and Web access to a Grafana Server running at minimum version 8.0. We recommend first downloading and installing a local copy of Grafana Server to test the setup procedures, before installing the plugins on your production Grafana instance. You can install a local copy of Grafana web server from here: Download Grafana from Grafana Labs.
- Grafana Toolkit installed on your system. To install, run the npm command:
npm i @grafana/toolkit - Web access to your Zebrium instance.
Current Zebrium Plugins
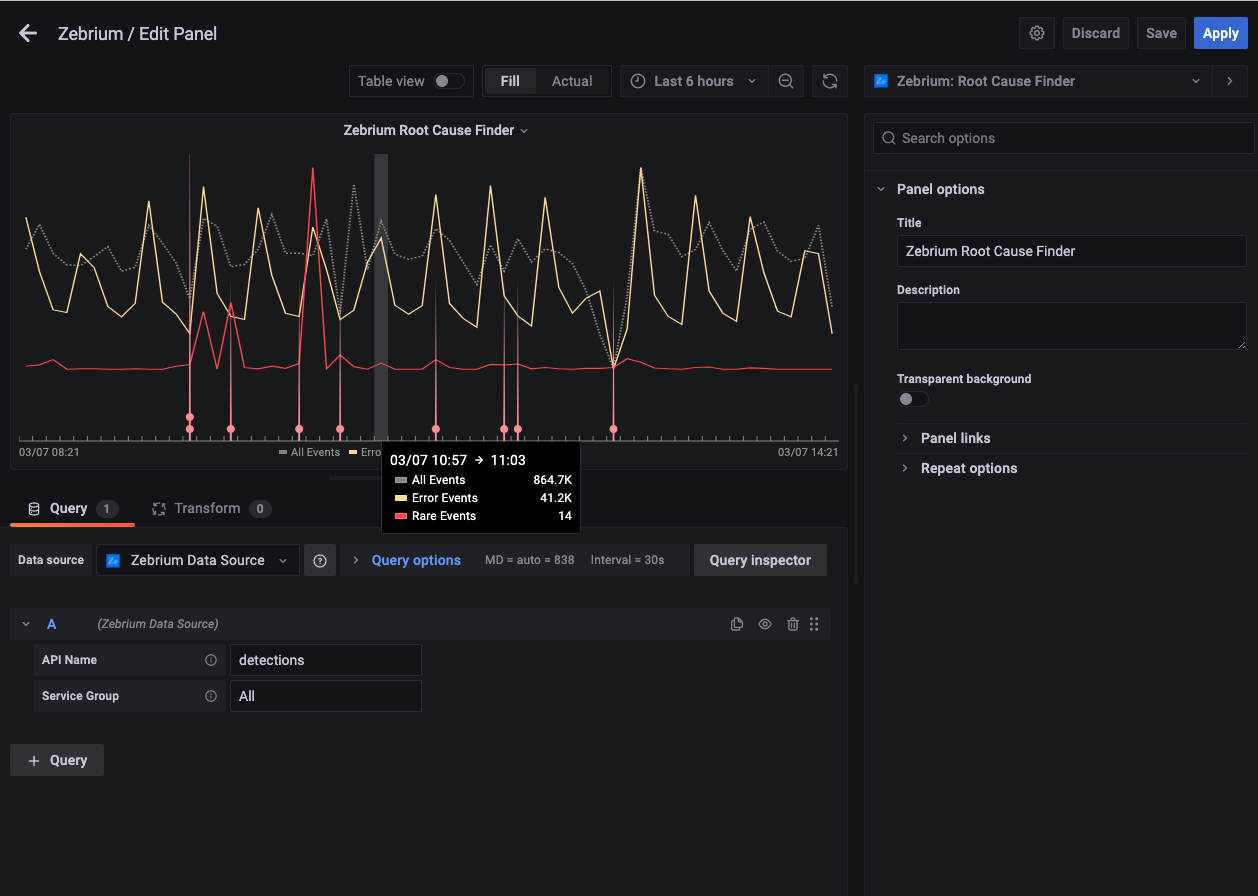
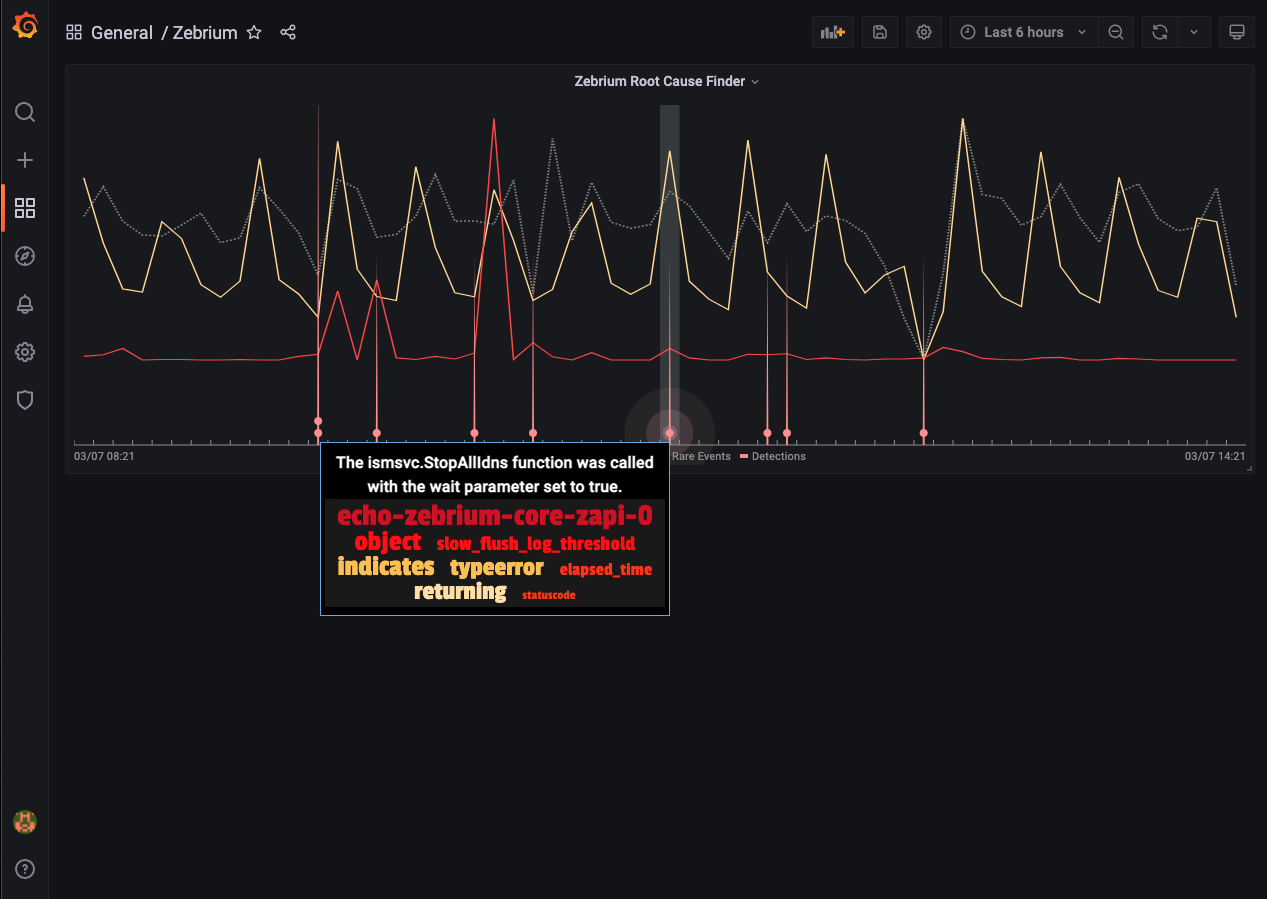
- Zebrium Root Cause Finder: plots counts of all log events, error events and rare events overlaid with detections found by Zebrium’s machine learning.
- Zebrium Data Source: provides the API access layer for Zebrium panel plugins.
Integration Details
STEP 1: Download Plugins from GitHub
- Use the following path to download the Zebrium Grafana plugins
https://github.com/zebrium/grafana-plugin/releases
STEP 2: Sign & Install Plugins
- Stop your Grafana Server.
- Move the plugins you downloaded from GitHub under your Grafana Server plugins directory. For example, if your Grafana Server is installed on the path
/Grafana-8.3.6\ install the downloaded plugins under/Grafana-8.3.6/data/plugins` - Ensure the Grafana Toolkit is installed on this system. If it isn’t, run the npm command:
npm i @grafana/toolkit - Follow Grafana’s signing instructions here for signing a private plugin: Sign a plugin
- Note: You must sign each plugin separately and you must sign them as a private plugin.
cd /[PATH TO GRAFANA SERVER]/data/plugins/ze-datasourceand sign as a private plugin.cd /[PATH TO GRAFANA SERVER]/data/plugins/ze-detectionsand sign as a private plugin.
- Restart your Grafana Server. For example, if your server is in /Grafana-8.3.6, switch to that directory and run
./bin/grafana-server web - Check the Grafana server logs to verify the new plugins have been registered

STEP 3: Create a Secure Access Token in Zebrium
- From the User menu area, click on the Settings (hamburger) Menu.
- Select Access Tokens.
- Click + Add Access Token button.
- Enter a Name for the token.
- Select Viewer for the Role.
- Select the Deployment for the token.
- Click the Add button.
- Copy the Access Token that was just created and save for use in STEP 4.
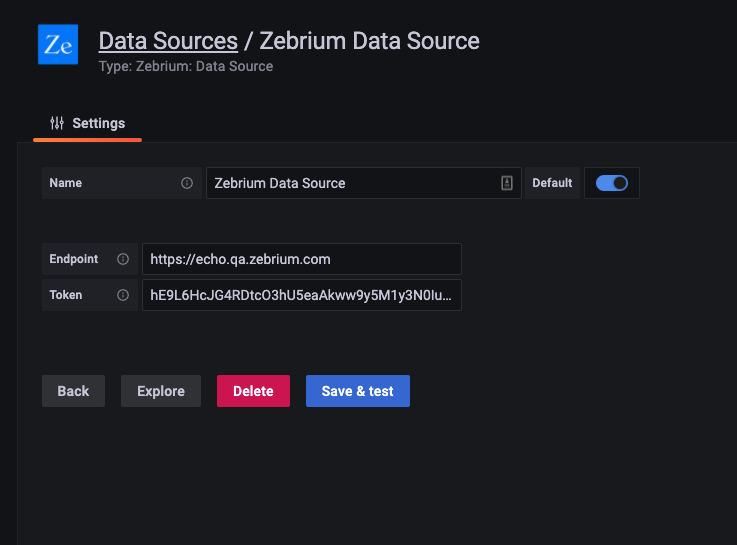
STEP 4: Setup Zebrium Datasource
- Open Grafana server in a web browser. If you have installed a local Grafana Server, it’s normally found at http://localhost:3000
- On the left toolbar find the Configure Menu (gear icon) and select data source.
- Click the button Add a Datasource
- Scroll the list of data sources, find and select Zebrium Data Source.
- On the Settings page, enter the API endpoint. This is the FQDN for your Zebrium instance where you generated the Access Token in STEP 3. For Zebrium SaaS, this will typically be:
https://cloud.zebrium.com. - Also on the settings page, enter the access token you created from STEP 3.
- Click the button Save and Test.
- Verify you see the message Successfully connected to Zebrium. If you don’t, review your entries above.
STEP 5: Install Zebrium Root Cause Finder on a dashboard
- Open Grafana server in a web browser. If you have installed a local Grafana Server, it’s normally found at http://localhost:3000
- On the left toolbar find the Create Menu (plus icon) and select dashboard.
- On this new dashboard, click the button Add an Empty Panel. The panel setup screen will appear.
- In the upper right, open the list of visualizations and select the plugin Zebrium Root Cause Finder.
- In the query panel, select data source Zebrium Data Source.
- For API Name enter detections.
- For Service Group enter All. This will pull counts and detection data from all of your service groups. Alternatively, enter the name of a single service group to pull data from just that service group.
- Give your panel a name; we suggest Zebrium Root Cause Finder. Then save your Dashboard and give it a name.
- Verify that the Zebrium Root Cause Finder visualization shows up in the panel you just added.
Support
If you need help with this integration, please contact Zebrium by sending email to support@zebrium.com