Send Root Cause Detections to your Kibana Dashboards
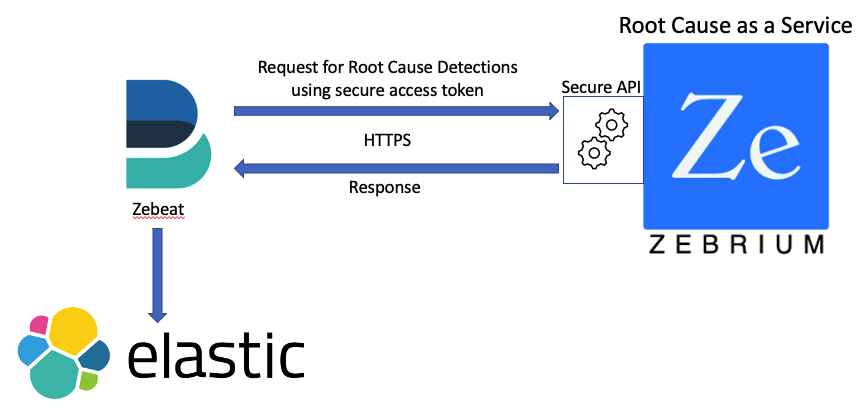
Integration Overview
- Create a secure access token in Zebrium for the Zebeat collector.
- Create Zebeat Override File and Deploy in your Kubernetes Environment using helm.
- Create a visualization in your Kibana Dashboard using the Root Cause Report and Log data provided by Zebeat.

Integration Details
STEP 1: Create a Secure Access Token in Zebrium
- From the User menu area, click on the Settings (hamburger) Menu.
- Select Access Tokens.
- Click + Add Access Token button.
- Enter a Name for the token.
- Select Viewer for the Role.
- Select the Deployment for the token.
- Click the Add button.
- Copy the Access Token that was just created and save for use in STEP 2.
STEP 2: Create Zebeat Override File and Deploy in your Kubernetes Environment
Create Zebeat Override File
- Go to the Zebeat github repository here.
- Navigate to the examples directory.
- Zebeat can send Root Cause Report data to Logstash or Elasticsearch directly.
- Choose one of the logstash or elasticsearch YAML files as a template for the zebeat override.yaml file you will use when deploying the Zebeat chart.
- Copy the contents of the YAML file template to your local disk as
override.yamlso you can customize for your environment. - Edit your local copy of the
override.yamlfile and make the following updates:- In the
hostparameter of themetricbeat.modulessection, add the FQHN for your Zebrium instance where you generated the Access Token in STEP 1. For Zebrium SaaS, this will typically be:https://cloud.zebrium.com. - In the
access_tokens.yamlparameter of theaccessTokenssection, add the FQHN for your Zebrium instance and the Access Token generated in STEP 1. - In the
output.elasticsearchoroutput.logstashsection, add the appropriatehostfor your Elastic deployment and any necessary credentials. - Save the override.yaml file.
- In the
Deploy Zebeat in your Kubernetes Environment
To install the chart with the release name zebrium:
helm repo add zebrium http://charts.zebrium.comhelm upgrade -i zebeat zebrium/zebeat --namespace zebrium --create-namespace -f override.yaml
STEP 3: Create Visualizations in your Dashboard
Zebeat provides two metricsets for visualizing Zebrium RCaaS data in Elastic:
- Detections - provides Root Cause Report data.
- Logs - provides metrics on Log Event counts.
Visualizing in Kibana
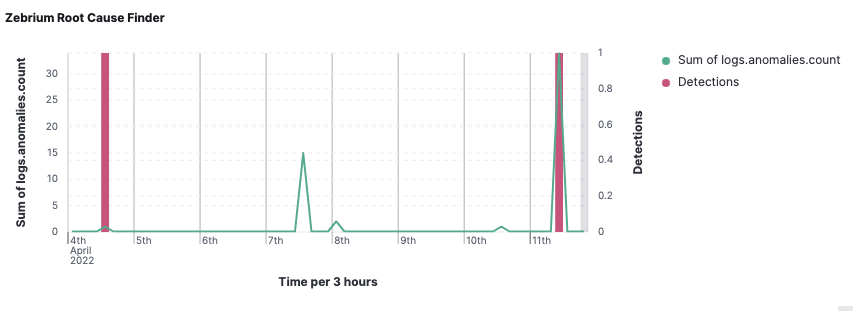
Here is a sample Chart visualization showing:
- Sum of Detections from the
detectionsmetric set usingdetections.alwaysone.countplotted as a bar chart with a Y-axis on the right-hand side. - Sum of Anomalies from the
logsmetricset usinglogs.anomalies.countplotted as a line chart with a Y-axis on the left-hand side.

Here is a sample Search visualization showing Root Cause Report details:
detections.title- NLP Summary.detections.word_cloud.w- List of Word Cloud strings.detections.report_url- Link for viewing full Root Cause Report details in the Zebrium portal.detections.significance- Significance of the Root Cause analysis determined by Zebrium ML (low, medium, high).detections.service_group- Service group where Root Cause detection was found.

Table of Important Fields
| Field name | Description |
|---|---|
| logs.all.count | Count of all log events received in a one minute duration (per service_group) |
| logs.anomalies.count | Count of anomaly log events received in a one minute duration (per service_group) |
| logs.errors.count | Count of error log events received in a one minute duration (per service_group) |
| detections.alwaysone.count | Set to 1 each time there is a Zebrium Root Cause Report detection |
| detections.title | Title of the Root Cause Report (usually an NLP summary) |
| detections.word_cloud.w | List of words in the word cloud of the Root Cause Report (per service_group) |
| detections.report_url | URL of the Root Cause Report |
| detections.significance | Significance of the Root Cause Report (low, medium or high) |
| zebrium.service_group | Zebrium service group name for the corresponding metric or detection |
Sample Payloads for Detections and Logs Metricsets
Detections Metricset Payload
{
  "_index": ".ds-metricbeat-8.3.0-2022.04.07-000001",
  "_id": "u-aUGYABqSxIAr_l5fTX",
  "_version": 1,
  "_score": 1,
  "_source": {
    "@timestamp": "2022-04-11T16:56:53.000Z",
    "event": {
      "module": "zebrium",
      "duration": 292227850,
      "dataset": "detections"
    },
    "metricset": {
      "name": "detections",
      "period": 10000
    },
    "ecs": {
      "version": "8.0.0"
    },
    "host": {
      "name": "zebeat-67d8d6457b-8rblk"
    },
    "agent": {
      "type": "metricbeat",
      "version": "8.3.0",
      "ephemeral_id": "5c5a0778-b163-4187-916e-5fc1b730fbde",
      "id": "6c216ce2-16cc-4313-802d-2203a604159c",
      "name": "zebeat-67d8d6457b-8rblk"
    },
    "service": {
      "address": "https://cloud.zebrium.com",
      "type": "zebrium"
    },
    "zebrium": {
      "customer": "xyz16",
      "deployment": "trial",
      "service_group": "shop"
    },
    "detections": {
      "report_url": "https://cloud.zebrium.com:443/root-cause/report?deployment_id=xyz16_trial&itype_id=0ba3b7a6-5bfb-561a-591b-5324d08b86bd&inci_id=00062545-dd50-0000-0000-51900000f40e&ievt_level=2",
      "occurrence": {
        "count": 1
      },
      "word_cloud": [
        {
          "w": "mongodb",
          "b": 7,
          "s": 8
        },
        {
          "b": 8,
          "s": 7,
          "w": "sock-chaos-runner"
        },
        {
          "w": "carts",
          "b": 7,
          "s": 7
        },
        {
          "s": 6,
          "w": "exception",
          "b": 6
        },
        {
          "b": 6,
          "s": 3,
          "w": "sock-shop"
        },
        {
          "s": 6,
          "w": "org",
          "b": 5
        },
        {
          "b": 5,
          "s": 5,
          "w": "socket"
        },
        {
          "s": 5,
          "w": "dispatcherservlet",
          "b": 2
        }
      ],
      "alwaysone": {
        "count": 1
      },
      "includes_default": true,
      "title": "The kubelet was unable to create the order due to timeout from one of the services.",
      "significance": "medium"
    }
  },
  "fields": {
    "zebrium.service_group": [
      "shop"
    ],
    "detections.includes_default": [
      true
    ],
    "zebrium.deployment": [
      "trial"
    ],
    "zebrium.customer": [
      "xyz16"
    ],
    "service.type": [
      "zebrium"
    ],
    "agent.type": [
      "metricbeat"
    ],
    "detections.occurrence.count": [
      1
    ],
    "logstash_stats.timestamp": [
      "2022-04-11T16:56:53.000Z"
    ],
    "event.module": [
      "zebrium"
    ],
    "detections.word_cloud.b": [
      7,
      8,
      7,
      6,
      6,
      5,
      5,
      2
    ],
    "agent.name": [
      "zebeat-67d8d6457b-8rblk"
    ],
    "host.name": [
      "zebeat-67d8d6457b-8rblk"
    ],
    "beats_state.timestamp": [
      "2022-04-11T16:56:53.000Z"
    ],
    "beats_state.state.host.name": [
      "zebeat-67d8d6457b-8rblk"
    ],
    "timestamp": [
      "2022-04-11T16:56:53.000Z"
    ],
    "detections.report_url": [
      "https://cloud.zebrium.com:443/root-cause/report?deployment_id=xyz16_trial&itype_id=0ba3b7a6-5bfb-561a-591b-5324d08b86bd&inci_id=00062545-dd50-0000-0000-51900000f40e&ievt_level=2"
    ],
    "detections.word_cloud.w": [
      "mongodb",
      "sock-chaos-runner",
      "carts",
      "exception",
      "sock-shop",
      "org",
      "socket",
      "dispatcherservlet"
    ],
    "detections.title": [
      "The kubelet was unable to create the order due to timeout from one of the services."
    ],
    "kibana_stats.timestamp": [
      "2022-04-11T16:56:53.000Z"
    ],
    "detections.alwaysone.count": [
      1
    ],
    "metricset.period": [
      10000
    ],
    "detections.word_cloud.s": [
      8,
      7,
      7,
      6,
      3,
      6,
      5,
      5
    ],
    "agent.hostname": [
      "zebeat-67d8d6457b-8rblk"
    ],
    "metricset.name": [
      "detections"
    ],
    "event.duration": [
      292227850
    ],
    "@timestamp": [
      "2022-04-11T16:56:53.000Z"
    ],
    "agent.id": [
      "6c216ce2-16cc-4313-802d-2203a604159c"
    ],
    "ecs.version": [
      "8.0.0"
    ],
    "service.address": [
      "https://cloud.zebrium.com"
    ],
    "agent.ephemeral_id": [
      "5c5a0778-b163-4187-916e-5fc1b730fbde"
    ],
    "agent.version": [
      "8.3.0"
    ],
    "event.dataset": [
      "detections"
    ],
    "detections.significance": [
      "medium"
    ]
  }
}
Logs Metricset Payload
{
  "_index": ".ds-metricbeat-8.3.0-2022.04.07-000001",
  "_id": "Xi5MG4ABTsyT1lUpY2dd",
  "_version": 1,
  "_score": 1,
  "_source": {
    "@timestamp": "2022-04-12T00:52:00.000Z",
    "event": {
      "dataset": "logs",
      "module": "zebrium",
      "duration": 144691043
    },
    "metricset": {
      "name": "logs",
      "period": 10000
    },
    "service": {
      "address": "https://cloud.zebrium.com",
      "type": "zebrium"
    },
    "zebrium": {
      "service_group": "default",
      "customer": "xyz16",
      "deployment": "trial"
    },
    "logs": {
      "errors": {
        "count": 0
      },
      "anomalies": {
        "count": 0
      },
      "all": {
        "count": 27
      }
    },
    "ecs": {
      "version": "8.0.0"
    },
    "host": {
      "name": "zebeat-67d8d6457b-8rblk"
    },
    "agent": {
      "version": "8.3.0",
      "ephemeral_id": "5c5a0778-b163-4187-916e-5fc1b730fbde",
      "id": "6c216ce2-16cc-4313-802d-2203a604159c",
      "name": "zebeat-67d8d6457b-8rblk",
      "type": "metricbeat"
    }
  },
  "fields": {
    "zebrium.service_group": [
      "default"
    ],
    "zebrium.deployment": [
      "trial"
    ],
    "zebrium.customer": [
      "xyz16"
    ],
    "service.type": [
      "zebrium"
    ],
    "agent.type": [
      "metricbeat"
    ],
    "logstash_stats.timestamp": [
      "2022-04-12T00:52:00.000Z"
    ],
    "event.module": [
      "zebrium"
    ],
    "agent.name": [
      "zebeat-67d8d6457b-8rblk"
    ],
    "host.name": [
      "zebeat-67d8d6457b-8rblk"
    ],
    "beats_state.timestamp": [
      "2022-04-12T00:52:00.000Z"
    ],
    "logs.anomalies.count": [
      0
    ],
    "beats_state.state.host.name": [
      "zebeat-67d8d6457b-8rblk"
    ],
    "timestamp": [
      "2022-04-12T00:52:00.000Z"
    ],
    "kibana_stats.timestamp": [
      "2022-04-12T00:52:00.000Z"
    ],
    "metricset.period": [
      10000
    ],
    "agent.hostname": [
      "zebeat-67d8d6457b-8rblk"
    ],
    "logs.errors.count": [
      0
    ],
    "metricset.name": [
      "logs"
    ],
    "event.duration": [
      144691043
    ],
    "@timestamp": [
      "2022-04-12T00:52:00.000Z"
    ],
    "agent.id": [
      "6c216ce2-16cc-4313-802d-2203a604159c"
    ],
    "ecs.version": [
      "8.0.0"
    ],
    "service.address": [
      "https://cloud.zebrium.com"
    ],
    "agent.ephemeral_id": [
      "5c5a0778-b163-4187-916e-5fc1b730fbde"
    ],
    "agent.version": [
      "8.3.0"
    ],
    "event.dataset": [
      "logs"
    ],
    "logs.all.count": [
      27
    ]
  }
}
Support
If you need help with this integration, please contact Zebrium by emailing support@zebrium.com.