Send Root Cause Detections to your Datadog Dashboards
Note: In addition to the integration described below, we have also built a custom Datadog Widget. Select Integrations in your Datadog UI and search for Zebrium for more details (contact Zebrium for further information).
Integration Overview
- Create an API Key in Datadog.
- Create a Datadog Integration in Zebrium using the information from step 1.
- Add Zebrium Root Cause Report events and Log metrics to your Datadog Dashboard.
Integration Details
STEP 1: Create an API Key in Datadog
- From the Main Navigation panel in Datadog, hover over your Datadog Login Name and select Organization Settings.
- Click on API Keys.
- Click the + New Key button.
- Enter a Name for the API Key and click Create Key.
- Copy and save the Key for use in STEP 2.
STEP 2: Create a Datadog Integration in Zebrium to Send Detections to Datadog
- From the User menu area in Zebrium, click on the Settings (hamburger) Menu.
- Select Integrations.
- Scroll to the Observability Dashboards section and click on Datadog Events and Metrics.
- Click on the Create a New Integration button.
- Click on the General tab.
- Enter an Integration Name for this integration.
- Select the Deployment for the integration.
- Select the Service Group(s) for the integration.
- Click on the Send Detections tab.
- Click on the Enabled button.
- Enter the API Key created in STEP 1 above.
- Click the Save button.
STEP 3: Add Zebrium Root Cause Report Detections and Log count metrics to any of your Datadog Dashboards
Zebrum sends events and metrics to Datadog as follows:
- Events - events are sent each time a Zebrium Root Cause Report Detection occurs.
- Metrics - metrics are sent for counts of all log events, error log events and anomaly log events
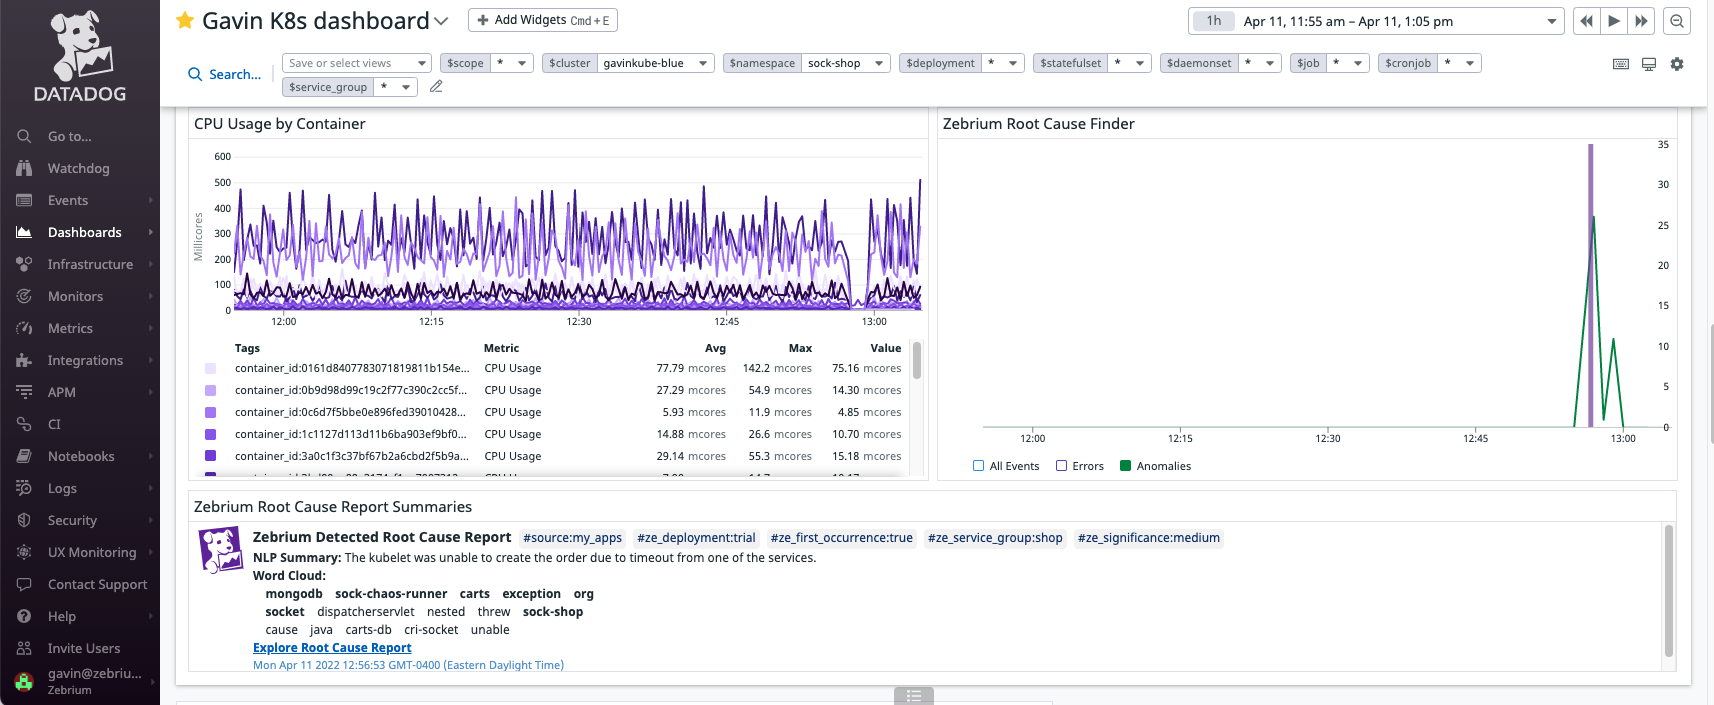
Visualizing Zebrium Data in Datadog
Here is a sample Chart visualization showing:
- A Root Cause Finder panel that displays a vertical bar whenever a Zebrium detection occurs. This allows you to easily see detections that are aligned with other metrics on your dashboards.
- A Root Cause Reports Summary panel that list summary information for each Zebrium detection.
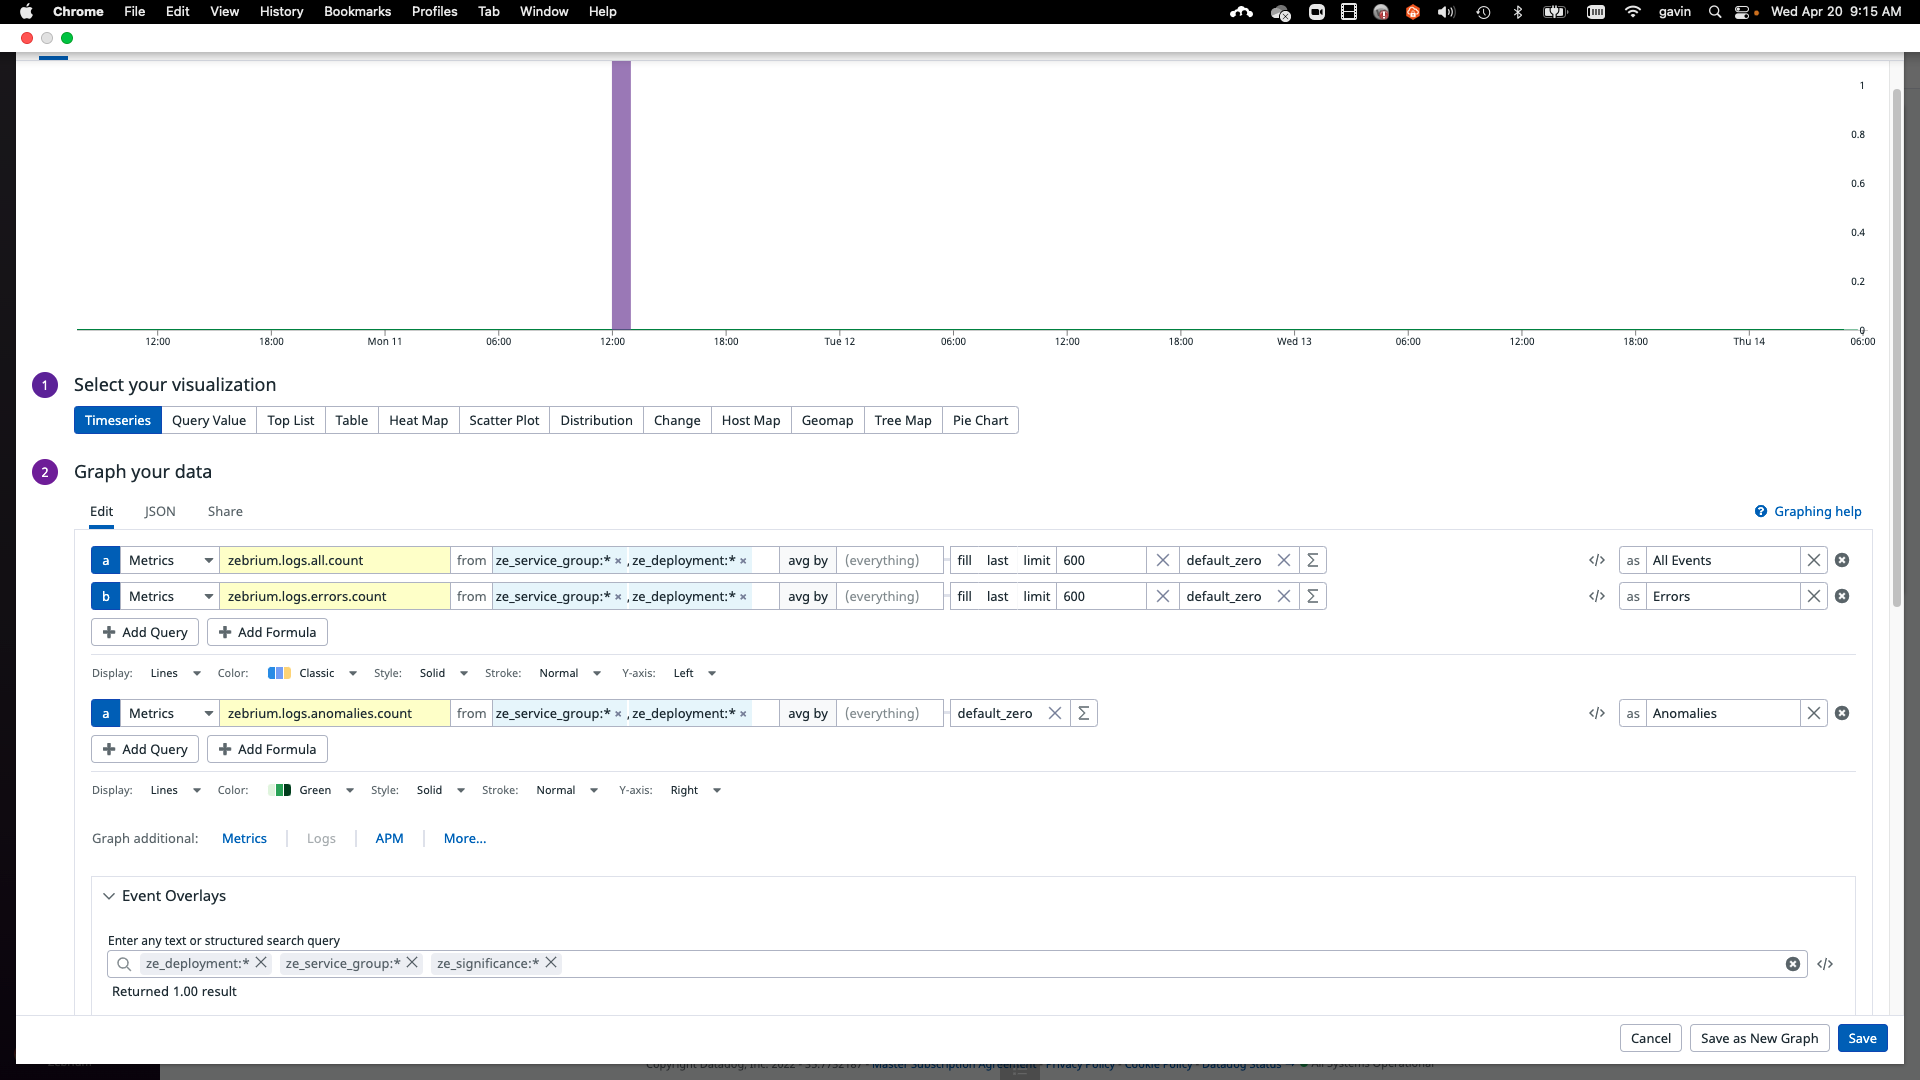
Here is a screen shot showing the definition of the Root Cause Finder Panel:
Here is a screen shot showing the definition of the Root Cause Reports Summary Panel:
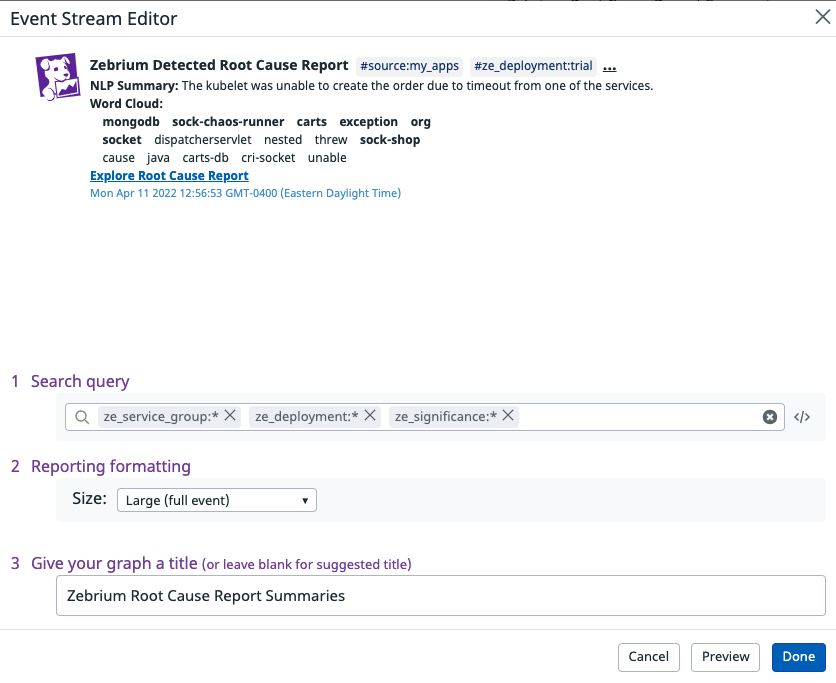
Table of Important Metric Names
| Metric Name | Description |
|---|---|
| zebrium.logs.all.count | Count of all log events received in a one minute duration (per service_group and deployment) |
| zebrium.logs.anomalies.count | Count of anomaly log events received in a one minute duration (per service_group and deployment) |
| zebrium.logs.errors.count | Count of error log events received in a one minute duration (per service_group and deployment) |
| ze_service_group | Zebrium service group name for the corresponding metric or event |
| ze_deployment | Zebrium deployment name for the corresponding metric or event |
| ze_significance | Significance of the Root Cause Report (low, medium or high) |
Support
If you need help with this integration, please contact Zebrium by sending email to support@zebrium.com